From 17 Minutes to 8 Seconds: Strategic Performance Optimization for Engineering Teams
From 17 Minutes to 8 Seconds: Strategic Performance Optimization for Engineering TeamsLeading engineering teams means constantly balancing technical excellence with organizational needs. I found myself facing a perfect example of this challenge when helping out the Open Web Application Security Project (OWASP). When I joined the core team for OWASP’s Web Security Testing Guide, I found a critical infrastructure problem that was silently undermining both our security mission and our ability to ship quality work efficiently.
OWASP is a big organization with an even bigger website to match. The site serves hundreds of thousands of visitors with cybersecurity resources that security professionals worldwide depend on. But beneath this successful exterior, we had a problem that most engineering leaders will recognize: broken processes that no one had time to fix, creating cascading inefficiencies across our entire development workflow.
OWASP.org lacked any centralized quality assurance processes and was riddled with broken links. Customers don’t like broken links; attackers really do. These weren’t just user experience issues—they represented real security vulnerabilities that could enable attacks like broken link hijacking and subdomain takeovers. Here we were, an organization dedicated to web security, with our own infrastructure exposing the exact vulnerabilities we taught others to prevent.
When Infrastructure Problems Become Leadership Problems
The broken link problem at OWASP had all the hallmarks of technical debt that had become organizational debt: volunteers avoided updating content because they knew links might break, and quality suffered because manual checking was impractical. Our CI/CD pipeline had a glaring gap where automated link validation should have been.
The underlying issue was both technical and strategic. We needed a solution that could integrate into our development workflow, scale with our volunteer contributor model, and actually get adopted by teams who were already stretched thin. This meant thinking beyond just building a tool; I needed to design a solution that addressed the human and process challenges alongside the technical ones.
Strategic Requirements Beyond Just “Make It Work”
When I proposed building an automated link checking solution, the requirements went far beyond technical functionality. As engineering leaders, we know that tools succeed or fail based on adoption, maintainability, and organizational fit. Our solution needed to:
- Integrate seamlessly into existing CI/CD workflows without disrupting volunteer contributors
- Provide actionable reports that non-technical content maintainers could understand and act on
- Run efficiently enough to avoid becoming a bottleneck in our deployment process
- Scale with OWASP’s distributed, volunteer-driven development model
The technical challenge was, essentially, to build a web crawler. The leadership challenge was ensuring it would actually solve our organizational problem rather than just creating another tool that sits unused.
This required making strategic decisions about language choice, architecture, and performance that balanced multiple constraints: team familiarity (Python was the common denominator), performance requirements (CI/CD integration demanded speed), and long-term maintainability (volunteers needed to be able to contribute to the codebase).
Understanding the Real Cost of Performance Bottlenecks
As engineering leaders, we need to think about performance in terms of organizational impact, not just technical metrics. The latency numbers that every developer should know tell a story about where bottlenecks hide and how they compound:
| Type | Task | Time |
|---|---|---|
| CPU | execute typical instruction | 1/1,000,000,000 sec = 1 nanosec |
| CPU | fetch from L1 cache memory | 0.5 nanosec |
| CPU | branch misprediction | 5 nanosec |
| CPU | fetch from L2 cache memory | 7 nanosec |
| RAM | Mutex lock/unlock | 25 nanosec |
| RAM | fetch from main memory | 100 nanosec |
| RAM | read 1MB sequentially from memory | 250,000 nanosec |
| Disk | fetch from new disk location (seek) | 8,000,000 nanosec (8ms) |
| Disk | read 1MB sequentially from disk | 20,000,000 nanosec (20ms) |
| Network | send packet US to Europe and back | 150,000,000 nanosec (150ms) |
Peter Norvig first published these numbers some years ago in Teach Yourself Programming in Ten Years. While technology changes over the decades, the order-of-magnitude differences between these numbers remain as devastatingly accurate as ever.
These numbers reveal something critical for engineering leaders to know: network operations are over a million times slower than memory operations. In our link checker, every HTTP request was a network operation, meaning we were dealing with the slowest possible operation for a process that needed to run fast and efficiently in CI/CD.
A single-thread crawler workflow creates an inherent bottleneck:
- Fetch HTML from a page (network-bound operation)
- Parse links from the HTML content
- Validate each link by making HTTP requests (more network-bound operations)
- Track visited links to avoid duplicate work
- Repeat for every page found
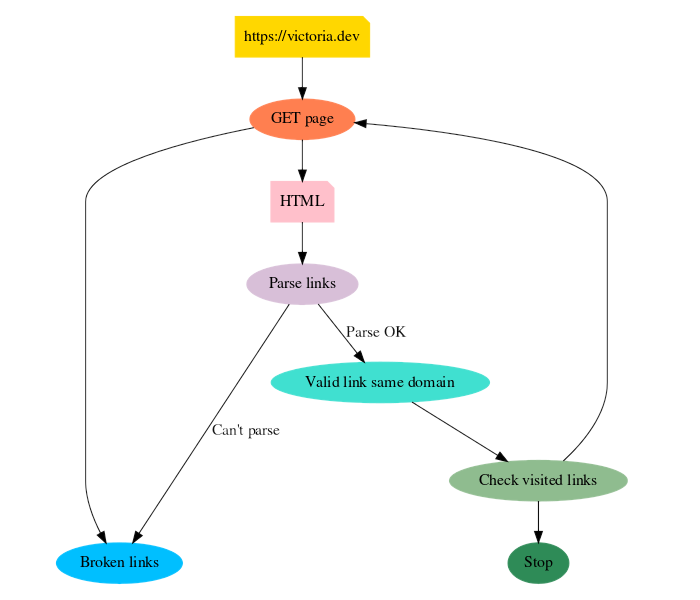
Mapping out the execution flow makes the issue clear to see: this process was fundamentally serial, with network latency dominating every step. For a site like OWASP.org with over 12,000 links, this meant potential runtime measured in hours, not minutes.
Bottlenecks like this cascade through entire organizations, affecting developer productivity, deployment confidence, and ultimately in the case of OWASP, our ability to deliver on our security mission effectively.
Checking these links serially would guarantee a performance bottleneck that would hurt team productivity, deployment confidence, and our ability to ship quality software consistently.
How Bottlenecks Cascade Through Engineering Organizations
How long would it have taken to check all 12,000 links on OWASP.org with a single-thread web crawler? We can make a rough estimate:
      150 milliseconds per network request
 x 12,000 links on OWASP.org
---------
1,800,000 milliseconds (30 minutes minimum)
A whole half hour, just for the network tasks. In the real world it would likely be much slower than that, since web pages are frequently much larger than one packet.
When your CI/CD pipeline includes a (very conservative minimum) 30-minute bottleneck, the impact extends far beyond technical metrics. Several things happen:
First, your feedback loops become painfully long. Contributors push changes and then wait more than half an hour to learn if they’ve broken anything. This delays iteration, reduces deployment confidence, and ultimately makes your team more conservative about shipping improvements.
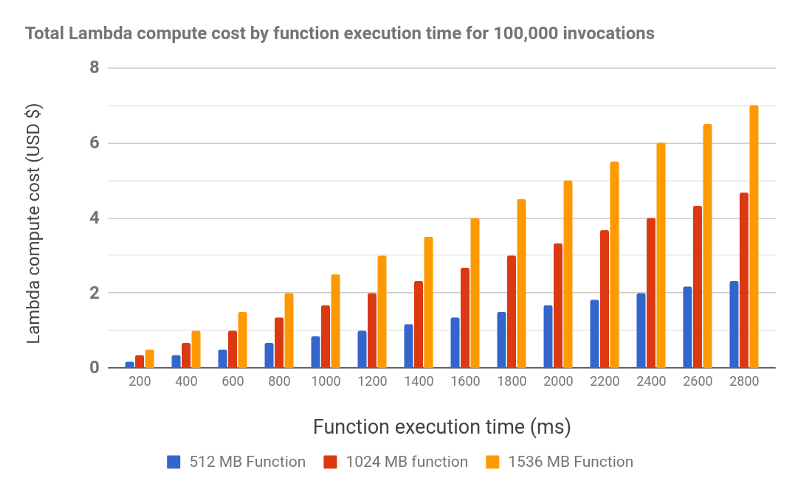
Second, to add insult to injury, the financial impact compounds quickly. In serverless environments like AWS Lambda, compute time directly translates to cost. A process that takes 30 minutes instead of seconds doesn’t just waste time—it multiplies your infrastructure costs dramatically.
But the hidden cost is team productivity. When your deployment pipeline has unpredictable bottlenecks, teams start working around them. They try to batch changes into huge PRs instead of making small incremental (and easier to merge) improvements. They skip running full test suites locally. They become hesitant to refactor or make structural improvements that might require multiple deployment cycles to validate.
Identifying and resolving bottlenecks can make the difference between teams that stall at fixing bugs and teams that ship new features fast.
Making Strategic Technology Decisions Under Constraints
This is where engineering leadership gets interesting: balancing competing constraints while making decisions that your team can actually execute on. I had to choose between Python (a comfortable language choice for everyone in the OWASP group) and Go (which offered better concurrency primitives and performance characteristics).
The decision matrix looked like this:
- Team familiarity: Python had broad adoption across OWASP contributors
- Performance requirements: Go’s goroutines made concurrent programming more straightforward
- Maintainability: We needed something contributors could debug and extend
- Long-term scalability: The solution needed to handle growing content without constant optimization
I chose to prototype the link checker in both languages. I built a multithreaded Python version that I dubbed Hydra, and a Go version that took advantage of goroutines. This gave us concrete data to inform the decision rather than relying on assumptions. This approach—building multiple solutions to validate architectural choices—is something I’ve found invaluable for critical infrastructure decisions.
Designing Solutions That Scale With Your Team
The good news is that once you identify a bottleneck, you can resolve it. Whether it’s scaling work efficiently across your team, code reviews, incident response, or in our case, link validation, the principle is the same: address the slowest operation.
Think of our single-thread web crawler as if it were one person handling all the work sequentially. The work gets done, but one person doesn’t scale well to thousands of requests. Working in serial, each request has to wait for the previous one to complete, creating an artificial constraint where we’re limited by the slowest individual operation.
Thankfully, link validation is an embarrassingly parallel problem. Each link can be checked independently, which means we could distribute the work across multiple concurrent processes, like having several people split up the work to help it go faster. In computing this is called multithreading.
By designing for concurrency from the start and building a multithreaded link checker, we’d have solution that could scale with different deployment environments, handle varying load patterns, and remain responsive even as OWASP’s content grew.
To illustrate, here are some snippets from the Go implementation. They incorporate some architectural insights that are relevant for any engineering leader designing concurrent systems.
1. Safe Concurrent Access
type Checker struct {
    startDomain             **string**
    brokenLinks             []Result
    visitedLinks            map[**string**]**bool**
    workerCount, maxWorkers **int**
    sync.Mutex
}
The sync.Mutex ensures our shared state remains consistent across goroutines, while the visitedLinks map uses O(1) lookup time to avoid creating new bottlenecks as our dataset grows.
When optimizing one constraint like network latency, make sure you’re not inadvertently creating new constraints elsewhere—like O(n) lookup times that degrade performance as your data grows.
2. Throttling
for i := range toProcess {
    wg.Add(1)
    checker.addWorker()
    go worker(i, &checker, &wg, toProcess)
    if checker.workerCount > checker.maxWorkers {
        time.Sleep(1 * time.Second) *// throttle down*
    }
}
wg.Wait()
Even when you can parallelize work, you need to respect system boundaries. Too many concurrent HTTP requests could overwhelm target servers or trigger rate limiting, so we built in backpressure to ensure our optimization doesn’t create problems for others. This is an effective way to balance between performance and being a good network citizen.
Measuring Impact: The Results That Matter for Engineering Teams
To obtain some concrete data, I compared the numbers between three implementations: a prototype single-thread Python program, the multithreaded Hydra version, and an implementation written in Go. The performance data from our three implementations tells a story about strategic technology choices and their organizational impact. Here’s a comparison run against my website with its few hundred links:
Single-Threaded Python Prototype
time python3 slow-link-check.py https://victoria.dev

real 17m34.084s
user 11m40.761s
sys     0m5.436s
Seventeen minutes for a site much smaller than OWASP.org meant our original approach would have been completely unusable in a CI/CD context.
Hydra: Multithreaded Python Version
time python3 hydra.py https://victoria.dev

real 1m13.358s
user 0m13.161s
sys     0m2.826s
The concurrency improvements brought us down to just over a minute—a 15x improvement that made CI/CD integration viable.
Go Implementation
time ./go-link-check --url=https://victoria.dev

real 0m7.926s
user 0m9.044s
sys     0m0.932s
Eight seconds. This performance improvement fundamentally changed how teams could interact with the tool. With this level of efficiency, link checking could become part of every deployment without friction. Contributors wouldn’t think twice about running it locally. Instead of being a barrier, link checking would be invisible infrastructure.
As fun as it is to simply enjoy the speedups, we can directly relate these results to everything we’ve discussed so far. Consider taking a process that used to soak up seventeen minutes and turning it into an eight-second-affair instead. Not only will that give developers a much shorter and more efficient feedback loop, it gives teams the ability to develop faster while costing less. To drive the point home: a process that runs in seventeen-and-a-half minutes instead of eight seconds will also cost over a hundred and thirty times more to run.
These numbers represent more than technical metrics. They show how strategic performance optimization can transform a tool from something teams avoid to something they rely on.
The Leadership Framework: Turning Performance Wins Into Organizational Impact
The 130x performance improvement we achieved demonstrates a leadership approach to identifying and breaking bottlenecks that affects entire engineering organizations.
When engineering leaders see a 17-minute process become an 8-second process, we should be asking: what other critical workflows are creating similar friction? Where else are teams working around inefficient processes instead of addressing them? How many small compounding delays are preventing our organization from shipping quality software consistently?
The OWASP link checker became a case study for our broader infrastructure strategy. We learned that volunteer contributors were more likely to maintain content quality when the feedback loop was immediate. We discovered that CI/CD performance directly influenced how teams approached incremental improvements versus risky big-batch changes. Most importantly, we proved that strategic performance optimization could transform organizational behavior.
Start with understanding the human and organizational impact, design solutions that respect team constraints, and measure success by adoption and workflow improvement. When you can turn a deployment blocker into invisible infrastructure, you’re optimizing both code and organizational dynamics by removing friction that allows your entire team to focus on delivering value rather than fighting with tools.